
/product.jpg)
TL;DR
ICP testing is a periodic laboratory audit of the elemental composition of a water sample. It is especially useful for finding unexpected metals, broad major-ion imbalances, and trace-element patterns that ordinary hobby kits cannot resolve.
The safest way to use a report is to separate measurement from interpretation. The instrument measures an element. The laboratory compares that value with its reference system and may add a color, score, or dosing recommendation. You still need tank history, repeat testing, source inspection, and animal response before turning one colored box into a treatment plan.
What ICP actually measures
Both ICP-OES and ICP-MS begin by turning a prepared liquid sample into an aerosol and carrying it into an extremely hot argon plasma. The plasma breaks the sample down far enough for the instrument to identify and quantify elements.
ICP-OES reads characteristic wavelengths of light emitted by excited atoms and ions. ICP-MS creates ions, separates them mainly by mass-to-charge ratio, and counts them. ICP-MS generally reaches lower detection limits, which is useful for ultra-trace elements, but greater sensitivity does not remove the need for calibration, interference correction, blanks, and seawater-specific method validation.
The practical difference between the two methods in a reef-water report.
| Method | What the detector reads | Practical strength | Important limitation |
|---|---|---|---|
| ICP-OES | Element-specific emitted light | Fast multi-element measurement across major, minor, and many trace elements | Spectral overlap, salt matrix, dilution, and detection limits still matter |
| ICP-MS | Ions separated by mass-to-charge ratio | Much lower detection limits for many ultra-trace elements and contaminants | Mass interferences, matrix effects, and contamination control become even more important |
Some commercial reports combine several instruments. ATI, for example, describes using ICP-OES and ICP-MS alongside ion chromatography for nitrate and fluoride and a separate titration system for carbonate hardness. A value can appear on an “ICP report” without having been measured by the plasma instrument itself.
What a real ICP report looks like
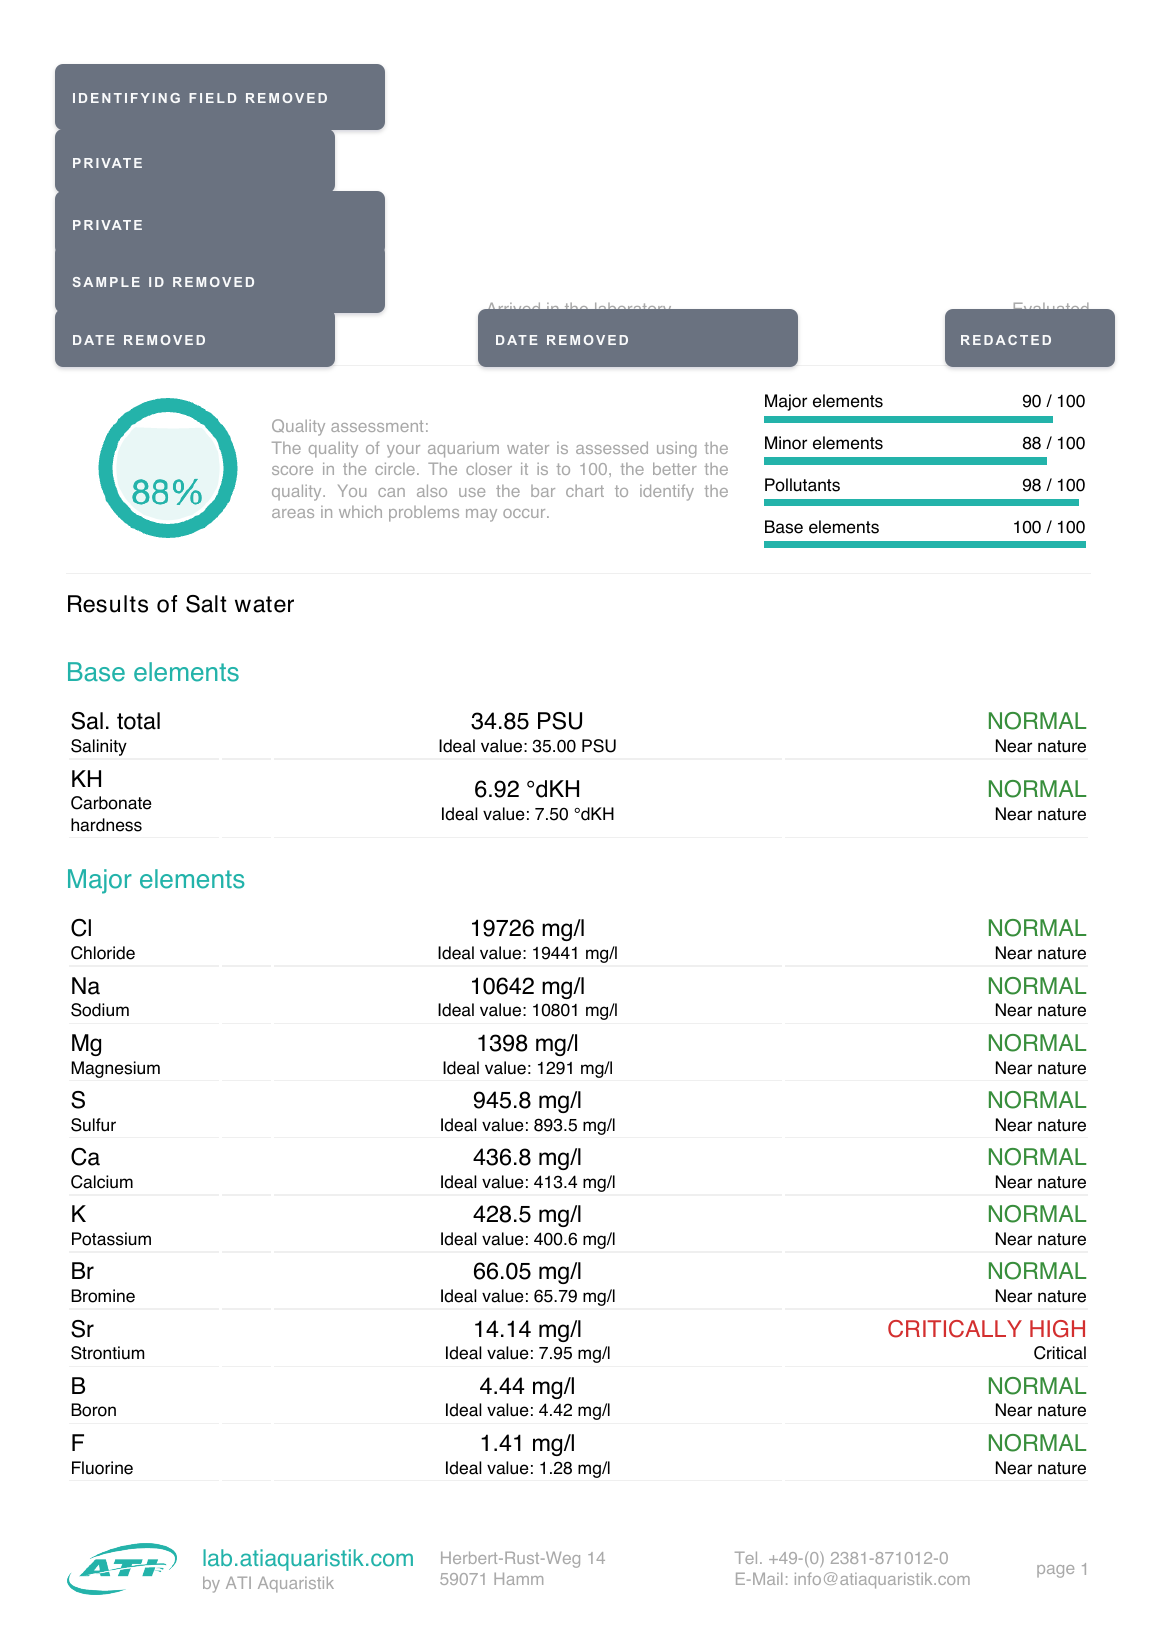
The example below is a real ATI Aquaristik laboratory report from a Reef Trak test sample. It shows the familiar structure: an overall assessment, category scores, measured values, laboratory reference values, and status flags.
Notice that the report can look reassuring at the summary level while still flagging one individual result strongly. That is why the score is not a diagnosis, and the red word beside one element is not a complete treatment plan. Read the measurement, unit, reference, sample context, and recommendation as separate pieces of information.
Elements are not complete compounds or sources
An elemental result tells you how much tin, aluminum, copper, iodine, strontium, or another measured element was detected under that method. It usually does not identify the complete chemical form, whether the element was freely dissolved or associated with a particle, or which object released it.
Elevated tin therefore does not prove that one magnet is rusting. Aluminum does not automatically prove that a particular phosphate remover is the cause. Silicon can come from source water, dust, salt, glass-related handling, or another input. The report gives you a lead. Tank inspection and controlled follow-up identify the source.
The same caution applies to a low trace element. A low number does not prove the tank needs an immediate concentrated dose. Confirm the unit, detection limit, laboratory target, recent dosing, salt mix, water-change history, and whether a second result shows the same direction.
What ICP cannot replace
A plasma instrument is not a substitute for the measurements that describe the tank every day. Alkalinity can move quickly and should be followed with a suitable titration or monitor. Temperature, salinity, pH, nitrate, and phosphate need their own methods. A lab may add some of those measurements to the report, but that does not make periodic mail-in testing a replacement for routine home testing.
- Alkalinity and its day-to-day consumption trend
- Temperature and daily temperature stability
- Salinity and calibration of the salinity instrument
- pH, including the daily high and low
- Nitrate and phosphate at the cadence the system requires
- Visual animal health, feeding response, tissue condition, and nuisance growth
Calcium and magnesium are often included in lab reports, but a high-demand tank may still need local testing between laboratory samples. ICP is best treated as a wider periodic view, not the only view.
Why two laboratories can disagree
A difference between laboratories does not automatically mean one result is dishonest or useless. Methods can differ in dilution, wavelengths or masses selected, calibration standards, internal standards, interference correction, sample preparation, detection limits, rounding, and reference-water assumptions.
Seawater is also a difficult matrix because major salts are present at concentrations far above the trace elements of interest. EPA analytical methods explicitly require laboratories to account for spectral, chemical, physical, memory, and matrix interferences. The relevant question is whether the method is controlled and repeatable for seawater, not whether every lab prints the same last decimal place.
When tracking a trend, staying with one laboratory and one sampling routine reduces avoidable method noise. If a surprising result would trigger a large intervention, confirmation with a repeat sample or a second qualified laboratory can be worth more than acting on the first flag.
Sample contamination can create a convincing false lead
Trace testing is sensitive enough that sampling technique matters. Residue from hands, metal tools, dust, a dirty work surface, a supplement spill, or an incompletely rinsed vial can enter the sample. Taking water immediately after dosing can also create a result that is real for the vial but unrepresentative of the aquarium.
- Use the laboratory vial and follow its rinse and fill instructions
- Sample a clean, well-mixed area away from a fresh dose or additive stream
- Keep fingers, tools, towels, and work surfaces away from the cap interior and vial opening
- Close the vial immediately and apply the correct label without mixing caps or samples
- If source water is included, sample it with the same care and keep it clearly separated
- Record the sample date, recent water changes, dosing, and unusual maintenance
How to decide what deserves action
Do not rank decisions by color alone. Rank them by severity, confidence, animal response, and whether there is a plausible source. The same number can call for a different response in a healthy tank with one isolated flag than in a tank showing rapid tissue loss beside a visibly corroded component.
A practical response ladder for laboratory flags.
| Situation | Best first response | What to avoid |
|---|---|---|
| Strongly elevated contaminant plus animal distress or an obvious failing source | Remove or isolate the source, use appropriate corrective filtration or water changes, and confirm with prompt follow-up testing | Waiting for several more routine tests while exposure continues |
| Unexpected contaminant with no symptoms and no obvious source | Inspect equipment and inputs, review sampling, preserve the report, and confirm the finding before a disruptive correction | Replacing half the system based on one guess |
| Low trace element with no matching symptom or consumption history | Review the complete method, diet, salt, and dosing record, then confirm the trend | Dosing every low box to the laboratory target at once |
| Major ions broadly shifted in the same direction | Verify salinity first, then compare salt mix, source water, and recent water changes | Correcting each element independently before checking concentration |
| One borderline result in an otherwise stable tank | Watch, document, and retest on a consistent schedule | Turning analytical noise into a new daily dose |
How to investigate an unexpected metal
Start with the wet hardware and work outward. Inspect pump shafts, wet-side magnets, frag-rack magnets, heater jackets, hose clamps, probes, screws, light mounts exposed to salt spray, and any metal fitting near the sump. Swollen seams, cracked coatings, rust stains, and a magnet that no longer sits flat deserve attention.
Then inspect inputs. Review RO/DI water, salt mix, food, frozen-food rinse water, trace supplements, two-part stock, kalkwasser, reactor media, filter media, and anything used during maintenance. If both aquarium and source-water samples show the same element, the search starts upstream. If only the aquarium sample shows it, focus on in-tank accumulation and equipment.
Change one plausible source at a time when the situation is not acute. That makes the follow-up report informative. Replacing every pump, changing salt, adding several adsorbers, and dosing four trace elements on the same day may improve the tank, but it will not teach you which action mattered.
When to retest
Retest after the correction has had enough time to change the water you are measuring. For a routine investigation, that usually means giving water changes, adsorption media, source replacement, or dosing changes time to operate, then sampling again under the same conditions. A next-morning sample can be too soon to represent the system.
Retest sooner when the first result suggests an acute exposure and the follow-up is part of verifying an emergency response. Retest later when you are checking a slow trace-element trend. There is no universal calendar interval that fits every contaminant, tank volume, and correction method, so document what changed and choose a date that can actually test the hypothesis.
The most useful comparison keeps the laboratory, sample location, time relative to dosing, and recent maintenance as consistent as possible. A trend built from controlled samples is more valuable than a folder of unrelated snapshots.
Keep the report connected to the tank history
A lab PDF is most useful when it does not become an isolated file. Reef Trak imports reports from supported ICP laboratories and keeps the source, date, values, and later tank events together. That lets you compare a metal flag with equipment changes, a trace-element result with dosing, and a retest with the correction that happened between samples.
The goal is not to automate blind correction. It is to preserve the evidence so the next decision has more context than the first one.
The bottom line
ICP testing is one of the best tools available for seeing beyond the small group of parameters measured at home. It can reveal contamination leads, depletion patterns, and broad chemistry shifts that would otherwise stay invisible.
Its strength is measurement, not certainty. An ICP report tells you what the method detected in the sample. Good reef keeping begins with the next questions: Is the result repeatable? Does it fit the tank history? What source could explain it? What is the smallest safe action that can test that explanation?